FIG. S7. Climatic suitability in Australasia for (A) B. dorsalis and (B) F. arisanus with absences. Scale: 1:120,000,000.
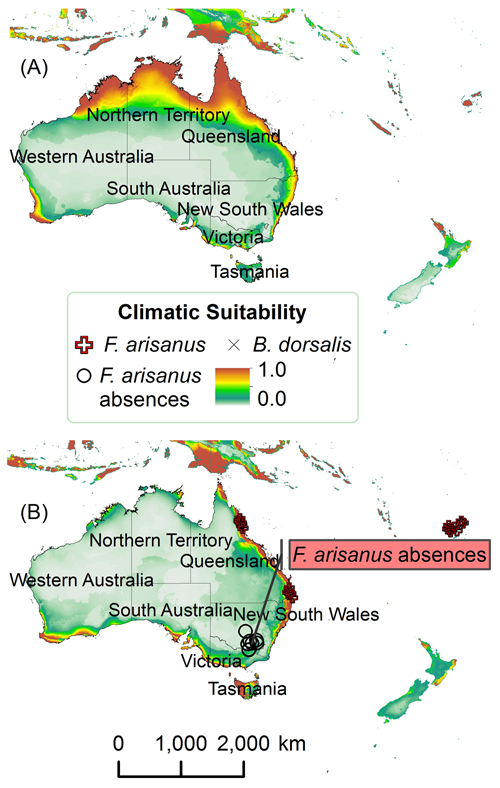
FIG. S8. Climatic suitability in Hawaii for (A) B. dorsalis and (B) F. arisanus. Scale: 1:8,100,000.
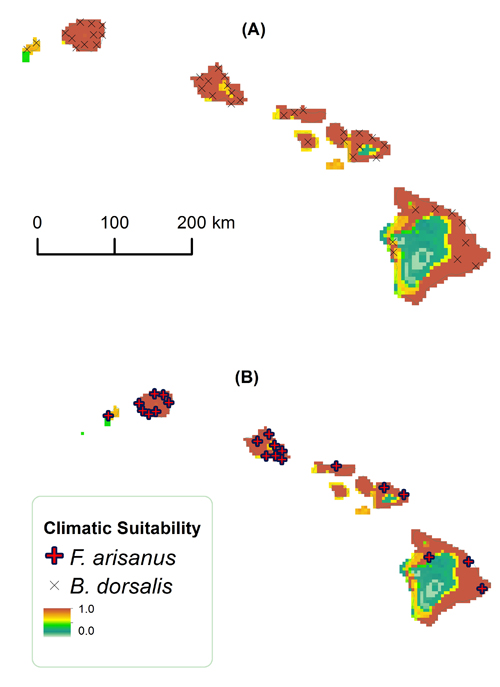
TABLE S5. Cross–correlations (Pearson’s correlation coefficient, r) among climatic variables. (r ≥ |0.75| are shown in bold.). When two variables were correlated, the variable that had a higher percent contribution and training gain was retained.
|
|
bio1 |
bio2 |
bio3 |
bio4 |
bio5 |
bio6 |
bio7 |
bio8 |
bio9 |
bio10 |
bio11 |
bio12 |
bio13 |
bio14 |
bio15 |
|
bio2 |
0.52 |
|
|
|
|
|
|
|
|
|
|
|
|
|
|
|
bio3 |
0.83 |
0.39 |
|
|
|
|
|
|
|
|
|
|
|
|
|
|
bio4 |
−0.83 |
−0.22 |
−0.89 |
|
|
|
|
|
|
|
|
|
|
|
|
|
bio5 |
0.89 |
0.70 |
0.61 |
−0.51 |
|
|
|
|
|
|
|
|
|
|
|
|
bio6 |
0.96 |
0.36 |
0.88 |
−0.93 |
0.76 |
|
|
|
|
|
|
|
|
|
|
|
bio7 |
−0.73 |
0.00 |
−0.83 |
0.97 |
−0.36 |
−0.87 |
|
|
|
|
|
|
|
|
|
|
bio8 |
0.81 |
0.53 |
0.63 |
−0.50 |
0.84 |
0.70 |
−0.39 |
|
|
|
|
|
|
|
|
|
bio9 |
0.93 |
0.44 |
0.80 |
−0.86 |
0.79 |
0.94 |
−0.78 |
0.60 |
|
|
|
|
|
|
|
|
bio10 |
0.93 |
0.62 |
0.65 |
−0.58 |
0.98 |
0.82 |
−0.45 |
0.86 |
0.83 |
|
|
|
|
|
|
|
bio11 |
0.98 |
0.43 |
0.89 |
−0.92 |
0.79 |
0.99 |
−0.84 |
0.73 |
0.95 |
0.84 |
|
|
|
|
|
|
Bio12 |
0.37 |
−0.24 |
0.55 |
−0.54 |
0.11 |
0.48 |
−0.61 |
0.25 |
0.36 |
0.19 |
0.44 |
|
|
|
|
|
bio13 |
0.45 |
−0.10 |
0.57 |
−0.56 |
0.22 |
0.52 |
−0.58 |
0.37 |
0.40 |
0.29 |
0.50 |
0.89 |
|
|
|
|
bio14 |
0.04 |
−0.37 |
0.21 |
−0.23 |
−0.14 |
0.16 |
−0.33 |
−0.06 |
0.10 |
−0.07 |
0.11 |
0.70 |
0.39 |
|
|
|
bio15 |
0.36 |
0.51 |
0.28 |
−0.19 |
0.42 |
0.27 |
−0.07 |
0.44 |
0.26 |
0.41 |
0.32 |
−0.17 |
0.13 |
−0.51 |
|
|
bio16 |
0.44 |
−0.12 |
0.57 |
−0.56 |
0.21 |
0.51 |
−0.59 |
0.35 |
0.40 |
0.28 |
0.50 |
0.92 |
0.99 |
0.43 |
0.09 |
|
bio17 |
0.07 |
−0.37 |
0.24 |
−0.26 |
−0.12 |
0.19 |
−0.36 |
−0.04 |
0.12 |
−0.05 |
0.14 |
0.74 |
0.43 |
0.99 |
−0.51 |
|
bio18 |
0.21 |
−0.20 |
0.34 |
−0.32 |
0.01 |
0.27 |
−0.38 |
0.24 |
0.13 |
0.08 |
0.25 |
0.79 |
0.73 |
0.56 |
−0.11 |
|
bio19 |
0.24 |
−0.24 |
0.42 |
−0.39 |
0.05 |
0.35 |
−0.46 |
0.07 |
0.30 |
0.11 |
0.31 |
0.75 |
0.59 |
0.66 |
−0.27 |
|
Alt. |
−0.18 |
0.18 |
0.02 |
−0.04 |
−0.28 |
−0.14 |
−0.01 |
−0.33 |
−0.09 |
−0.31 |
−0.11 |
−0.08 |
−0.06 |
−0.07 |
0.15 |
|
|
bio16 |
bio17 |
bio18 |
bio19 |
Alt. |
|
bio17 |
0.46 |
|
|
|
|
|
bio18 |
0.75 |
0.58 |
|
|
|
|
bio19 |
0.61 |
0.69 |
0.37 |
|
|
|
Alt. |
−0.06 |
−0.07 |
−0.01 |
−0.09 |
|
Note: the correlations were significant at alpha = 0.05 unless otherwise stated; Alt. = Altitude; bio1–bio19 are bioclimatic WorldClim variables.
APPENDIX S1. Sources of GIS data.
- GADM database of Global Administrative Areas, Hijmans, R. Version 1.0. Berkeley.
- DIVA-GIS. 2011. Country Boundaries. http://www.diva-gis.org/gdata.
- Environmental Systems Research Institute Data and Maps. 2006. World Cities. Redlands. https://wagda.lib.washington.edu/data.
APPENDIX S2. Experiments with different MaxEnt settings and additional analyses.
The same variables and MaxEnt settings should not be used to model different species even if they have a similar ecological niche, as this will not lead to the most accurate model (Shcheglovitova & Anderson 2013). To prove this point, the top performing fly models’ variables were used to create a model for F. arisanus and the same was done to create another model for B. dorsalis. F. arisanus model maps were compared for the top performing F. arisanus model with bio layers: 2, 3, 5, 15, 16, 17, 19 feature types: LQPTH and RM: 1.5 and for the top performing B. dorsalis model with bio layers: 2, 4, 10, 15, 16, 19 feature types: LQPT and RM: 2. The top performing parasitoid models’ variables created a more realistic distribution map, that matched F. arisanus occurrences, than when the top fly model variables were used to map F. arisanus distributions. The model performance was much worse (△BIC of 131.9) from the top performing F. arisanus model (Table 2). Similarly, using the variable combinations for the top performing F. arisanus model to map the flies’ distribution led to a poorer performing model (△BIC of 76.6) (Table 1).
Since previous niche model studies for Tephritids did not employ the same MaxEnt settings as this paper does, some of the same settings used in other studies were used to compare to the current model’s results. Some of the previous studies used subsample, which is the default setting (De Meyer et al. 2010). Changing the MaxEnt settings to subsample 25% reduced model performance (higher omission rates) (Table 1).
To aid with model selection, models for both species were also tested with similar MaxEnt settings, and environmental variables as used in Hill and Terblanche’s (2014) MaxEnt study for the B. dorsalis spp. complex. The Hill and Terblanche (2014) study selected variables purely based on the fact that they were used to build Tephritid niche models in other studies and referred to them as an ‘expert–driven predictor variable set.’ A similar set of corresponding WorldClim variables to the CliMond variables (Kriticos et al. 2012) used in the Hill and Terblanche study were used. The models with the ‘expert–driven predictor variable set,’ did not perform well for either species (Tables 1 and 2), even when a bias grid was added in the current study, which was excluded in the (2014) study for more details see (Lane 2015).
In an attempt to expand the range of climatic suitability for F. arisanus, since it had less climatic suitability than the B. dorsalis model, different MaxEnt settings were used to build models. Changing the replicated run type from cross–validate to subsample 25%, did not expand the range of suitability for F. arisanus. F. arisanus showed less suitability in Northern Malaysia around occurrences, and it performed worse than the top model with cross–validate (Table 2). Also, using different types of sampling bias grid files and background selection methods did not expand climatic suitability. Finally, switching the MaxEnt settings to the least conservative model parameters: ‘extrapolate’ do not ‘do–clamping’ and do not do ‘fade–by–clamping’ did not increase climatic suitability for F. arisanus.
The novel climates area map was the same with the MaxEnt settings ‘extrapolate’ and ‘fade–by–clamping’ or do not ‘extrapolate’ and do not do ‘fade–by–clamping.’ Results with or without extrapolate and with or without clamping may be similar as four of the seven response curves for the variables included in the F. arisanus model declined to less than 0.5 suitability with the climate data from occurrences, thus clamping may not have had a strong impact on the models.
ACKNOWLEDGEMENTS
We are very grateful to Anthony R. Clarke and Amy Carmichael from the Queensland University of Technology, S. Vijaysegaran, (retired, formerly MARDI, Malaysia), Justin Bartlett, Queensland Primary Industries Insect Collection for F. arisanus occurrences from Asia and Australia. Luc Leblanc helped to georeference South Pacific occurrences. African fruit fly occurrences were provided by Jean-François Vayssières and Marc De Meyer and I.M. White’s Dacine True Fruit Flies of the Afrotropical Region fly dataset. Sunil Kumar was partially supported by a grant through the Washington Tree Fruit Research Commission (WTFRC) from the Foreign Agricultural Service of the U.S. Department of Agriculture (USDA), and U.S. Geological Survey (USGS). We thank Roger Vargas for advice and Joan Wu, Tewodros Wakie, Gregory S. Wheeler and anonymous reviewers for reviewing the manuscript.
AUTHORSHIP CONTRIBUTIONS
All authors contributed to the conception of the study. J. L. acquired and interpreted the data, created the figures and website, and drafted the manuscript. S. K. assisted with the methodology and data interpretation. J. L., S. K., and W. Y. helped revise the final manuscript.
REFERENCES
- De Meyer, M., Robertson, M.P., Mansell, M.W., Ekesi, S., Tsuruta, K., Mwaiko, W., Vayssières, J.–F., & Peterson, A.T., 2010. Ecological niche and potential geographic distribution of the invasive fruit fly Bactrocera invadens (Diptera: Tephritidae). Bulletin of Entomological Research 100: 35–48.
- Hill, M.P., & Terblanche, J.S., 2014. Niche overlap of congeneric invaders supports a single–species hypothesis and provides insight into future invasion risk: implications for global management of the Bactrocera dorsalis complex. PLoS ONE 9: e90121.
- Kriticos, D.J., Webber, B.L., Leriche, A., Ota, N., Macadam, I., Bathols, J., & Scott, J.K., 2012. CliMond: global high–resolution historical and future scenario climate surfaces for bioclimatic modelling. Methods in Ecology and Evolution 3: 53–64.
- Lane, J.M., 2015. Modeling the climatic suitability of Fopius arisanus (Hymenoptera: Braconidae) and its host fly Bactrocera dorsalis (Diptera: Tephritidae). M.S. thesis, 102 pp. Washington State University, Pullman.
- Shcheglovitova, M., & Anderson, R.P., 2013. Estimating optimal complexity for ecological niche models: A jackknife approach for species with small sample sizes. Ecological Modelling 269: 9–17.
Refer to: Entomologist’s Monthly Magazine Volume 154: 65-78, published 26 January 2018, for the main text for this article including additional maps.
| © 2018 J.M. Lane, Created Website | All Rights Reserved | Last Updated: February 2018 |